To favour corporates, rich, Govt of India "allowed" 3-fold increase in forgone taxes in a decade: Oxfam report
By A Representative
A new report published by the top international advocacy group Oxfam has estimated that the total revenue forgone in India as stated in the budget increased from Rs 2,06,700 crore in 2005-06 to Rs 5,89,285 crore in 2014-15, an increase by almost three times in just ten years, adding, most of this “forgone revenue” has gone in favour of the corporate sector.
Titled “India Inequality Report 2018: Widening Gaps”, the report has been authored by Himanshu, who is associate professor at the Centre for Economic Studies and Planning, Jawaharlal Nehru University, and is visiting fellow at Centre de Sciences Humaines, New Delhi, and has worked as fellow at Asia Research Centre of the London School of Economics.
Pointing out that, this mean, for every rupee of tax collected, the government was losing 56 paise of taxes, which could have been collected by the government, the report states, “Most of these exemptions benefitted the rich and the corporate sector. Within the corporate sector, it was the largest corporate groups which benefited the most.”
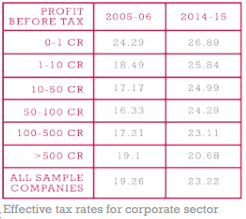
The report notes, though “as against the statutory tax rate of 33.66%, the effective tax rate in 2005-06 was 19.26% which increased to 23.22% by 2014-15”, what is of significance is, “Most of this increase was due to the increase in effective tax paid by the smaller companies that are above Rs 10 crore and below Rs 100 crore.”
It underlines, “The effective tax rate of companies with more than Rs 500 crore increased only marginally from 19.1% in 2005-06 to 20.7% in 2014-15”, adding, “By 2014-15, the effective tax rate of companies with lowest profits was the highest and companies in the highest tax bracket paid the least effective tax rate.”
“During the same year”, the report states, “The total subsidy on all schemes meant for the poor was Rs 2,53,913 crore and excluding the petroleum subsidy, it was only Rs 1,93,642 crore. That is, the benefits given to the rich and the corporates were almost three times the subsidy provided to the poor.”
The report estimates, “This amount was more than 15 times the allocation to Mahatma Gandhi National Rural Employment Guarantee Act (MGNREGA), the rural employment scheme. These exemptions, to the rich and the corporate sector, were accompanied by cut backs on social-sector and development spending.”
The report further says, that the trends in India’s development expenditure as a percentage of GDP suggest that the ratio fell continuously during 1985-1995, and while it did increase during 1996-2009, it has stagnated since.
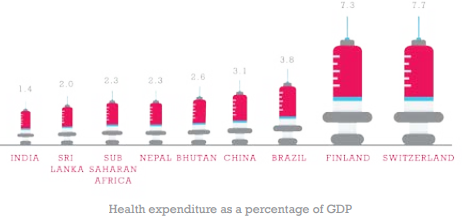
A comparison of India’s spending on education and healthcare to some other countries, says the report, shows that, if calculated as expenditure on education as a percentage of GDP, “India fares poorly not only in comparison to poorer countries in the Sub-Saharan Africa and Bhutan but also vis-à-vis developing countries like Brazil.”
“In terms of health expenditure, India is among the worst in the world”, the report says, adding,
“India’s public health expenditure stands around a paltry 1.4% of its GDP, lower than Sri Lanka, Bhutan, Sub-Saharan Africa, and Brazil.”
The result of government policy of helping the rich, the report suggests, is that India is currently among the countries with the highest levels of inequality, lower only to the Middle-Eastern countries. “The income share of the top 10% of the Indian population at 55% in 2016 is only second to the group of countries along with Brazil, second only to Middle-Eastern countries.”
“However”, the report underscores, “Unlike Middle-Eastern countries and Brazil which have had historically high levels of inequality but have seen a decline in the share of the top 10% in total income, India has seen a secular rise in the share of income accruing to the top 10% and top 1% of the population”.
It adds, “The top 1% of Indian population accounted for 22% of income in 2016, lower only to middle-eastern countries and Brazil. Here again, the trend in Brazil and the middle-eastern countries has been a secular decline as against a secular rise in the case of India in the last three decades.”


Comments